Graphs Diagrams of Global Warming and Climate


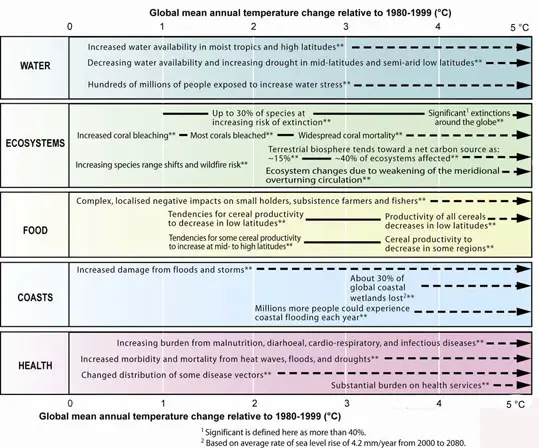
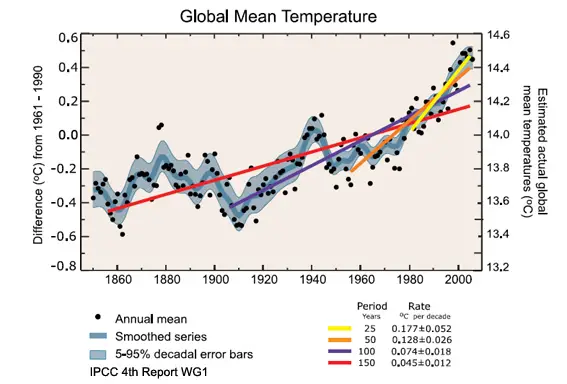
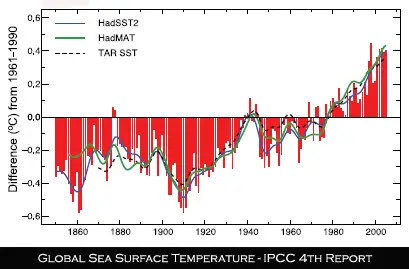
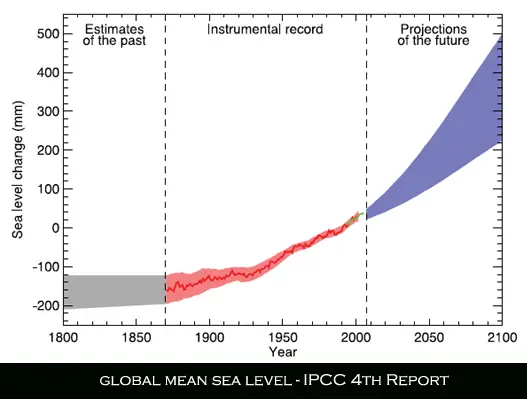
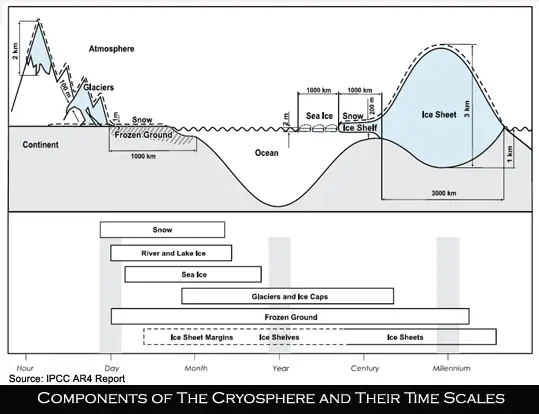
This page contains all the graphs diagrams of global warming and climate change that are used on this web site. Some of the material originates from the International Panel on Climate Change (IPCC), often buried in various reports. You can find IPCC presentation material on their site, should you wish to look at the originals.


There is another page which contains all the pictures and images used on this site, you can access the images here. One of the obvious ways to find images associated with this topic is to use the google search facility. Simply type in the name of the subject matter you are looking for and search within Google ‘images’. Yahoo also has a similar feature on their search page.


Carbon Dioxide

Methane

Nitrous Oxide

Millenium temperatures

thermohaline

land surafce temperature last 20,000 years

CO2 carbon dioxide per capita per country

carbon cycle

Antarctica Shelf diagram

Ice Age map

Ice moulin features

Projected water runoff map

Climate disasters insurance

Carteret Atoll map

Melted ice sea levels table

Vostok Vostock temperature and CO2 carbon dioxide

Sahul Last Glacial Maximum

Sea Ice extent

hydrogen fuel cell

Tuvalu map

Larsen ice shelf collapse

Sea levels

Hurricane Katrina

World energy and electricity chart

Global  insurance trend

Sahara Dust sand storm

thermohaline ocean system

ocean thermohaline

IPCC 2007 4th report Global Surface temperatures

IPCC 2007 4th report Temperature sea level and sow cover graph

IPCC 2007 4th report global continental temperature change

Vitoria Australia fre map January 2007

Davos Swiss Alps Switzerland map

Petratherm geothermal exploration and power model

Flue stack gas treatment

Integrated Gasification Combined Cycle IGCC diagram

Coal Fluidised Bed Combustion FBC

Ellesmere Island Nunavut Canada map

Solar area needed to generate world's electricity

sliver solar cell

solar trough process flow

Wave Dragon

Antarctic wordie Ice Shelf map

Nuclear Boiling Water Reactor

Nuclear Pressuized Water Reactor

B15 Antarctic Ross Shelf Iceberg map

IPCC 4th report magnitudes of impact

Chacaltaya glacier in Bolivia map

Chacaltaya glacier hydrological chart

Greenhouse effect

IPCC AR4 global average temperatures

IPCC AR4 Sea Surface Temperatures

IPCC AR4 Global average sea levels

IPCC AR4 cryosphere diagram

Earth tempaerature fluctuations

privacy policy

{ezoic-ad-1}

{ez_footer_ads}