Magnitudes of impact can now be estimated more systematically for a range of possible increases in global average temperature.
Since the IPCC Third Assessment, many additional studies, particularly in regions that previously had been little researched, have enabled a more systematic understanding of how the timing and magnitude of impacts may be affected by changes in climate and sea level associated with differing amounts and rates of change in global average temperature.
Examples of this new information are presented in the IPCC Table below. Entries have been selected which are judged to be relevant for people and the environment and for which there is high confidence in the assessment.
Depending on circumstances, some of these impacts could be associated with ‘key vulnerabilities’, based on a number of criteria in the literature (magnitude, timing, persistence/reversibility, the potential for adaptation, distributional aspects, likelihood and “importance” of the impacts). Assessment of potential key vulnerabilities is intended to provide information on rates and levels of climate change to help decision makers make appropriate responses to the risks of climate change.
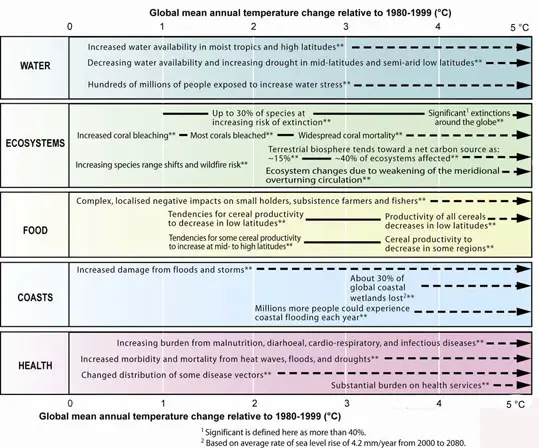
IPCC Table Above. Illustrative examples of global impacts projected for climate changes (and sea-level and atmospheric carbon dioxide where relevant) associated with different amounts of increase in global average surface temperature in the 21st century.
The black lines link impacts, dotted arrows indicate impacts continuing with increasing temperature. Entries are placed so that the left hand side of text indicates approximate onset of a given impact. Quantitative entries for water scarcity and flooding represent the additional impacts of climate change relative to the conditions projected across the range of SRES scenarios A1FI, A2, B1 and B2. Adaptation to climate change is not included in these estimations. All entries are from published studies recorded in the chapters of the Assessment. Confidence levels for all statements are high.