There is no single instrument measuring climate change. Instead there are thousands of measuring devices spread across the globe, on land, under the sea and in the air.
The climate system is a complex, interactive system consisting of the atmosphere, land surface, snow and ice, oceans and other bodies of water, and living things. The atmospheric component of the climate system is what we generally refer to as climate: climate is often defined as ‘average weather’. Climate is usually described in terms of the mean and variability of temperature, precipitation and wind over a period of time, ranging from months to millions of years (the classical period is 30 years, see weather and climate for more information on the difference between these two).
Countless empirical tests of numerous different hypotheses have now built up a massive body of Earth science knowledge. This repeated testing has refined the understanding of many aspects of the climate system, from deep oceanic circulation to stratospheric chemistry. Sometimes a combination of observations and models can be used to test planetary-scale hypotheses. For example, the global cooling and drying of the atmosphere observed after the eruption of Mt. Pinatubo provided key tests of particular aspects of climate models.
Climate science in recent decades has seen an increasing rate of advancement, particularly in field research and notably through the evolution of measuring climate change methodology and tools, including the models and observations that support and enable the research. During the last four decades, the rate at which scientists have added to the body of knowledge of atmospheric and oceanic processes has accelerated dramatically. As scientists incrementally increase the totality of knowledge, they publish their results in peer-reviewed journals.
Instruments Used When Measuring Climate Change
There are a number of key factors in measuring climate change, and they are broadly categorized below. The range of instrumentation used to observe and measure climate is truly amazing. By following the links below you can see the types of instruments, and where they are used.
Temperature When measuring climate change this is a primary and can be measured or reconstructed for the Earth’s surface, and sea surface temperature (SST).
Precipitation (rainfall, snowfall etc) offers another indicator of relative climate variation and may include humidity or water balance, and water quality.
Biomass and vegetation patterns may be discerned in a variety of ways and provide evidence of how ecosystems change to adapt to climate change.
Sea Level measurements reflect changes in shoreline and usually relate to the degree of ice coverage in high latitudes and elevations.
Solar Activity can influence climate, primarily through changes in the intensity of solar radiation.
Volcanic Eruptions, like solar radiation, can alter climate due to the aerosols that are emitted into the atmosphere and alter climate patterns.
Chemical composition of air or water can be measured by tracking levels of greenhouse gases such as carbon dioxide and methane, and measuring ratios of oxygen isotopes. Research indicates a strong correlation between the percent of carbon dioxide in the atmosphere and the Earth’s mean temperature.
Combining Observation and Measurements
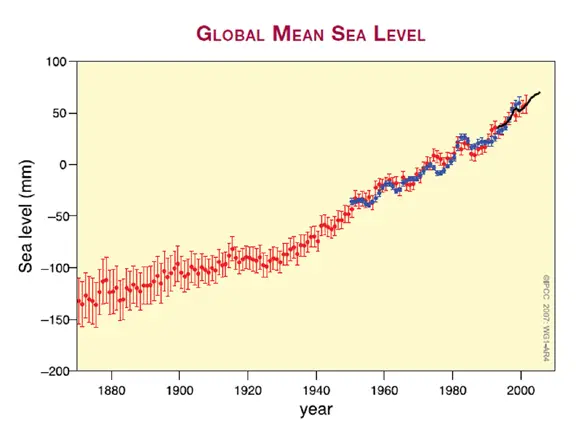
In understanding global climate changes it is necessary to combine many disciplines, including oceanography, meteorology, geomorphology, geology and paleoclimatology. As well as combining interdisciplinary studies, observations and measurements can be assembled over long time spans, using different measuring approaches. For example, the annual averages of the global mean sea level seen below are based on reconstructed sea level fields since 1870 (red), and the tide gauge measurements are since 1950 (blue) while the satellite altimetry is since 1992 (black). The units are in millimetres relative to the average for 1961 to 1990 and the error bars are at 90% confidence intervals.
By combining these three different approaches, scientists are able to build a clear picture of rising sea level that would not be possible if each was presented independently. You can also see with the introduction of accurate measuring, the confidence level for accuracy increases.
How Climate Knowledge Accumulates
Despite occasional major paradigm shifts, the majority of scientific insights, even unexpected insights, tend to emerge incrementally as a result of repeated attempts to test hypotheses as thoroughly as possible. Therefore, because almost every new advance is based on the research and understanding that has gone before, science is cumulative, with useful features retained and non-useful features abandoned. Active research scientists, throughout their careers, typically spend large fractions of their working time studying in depth what other scientists have done.
Superficial or amateurish acquaintance with the current state of a scientific research topic is an obstacle to a scientist’s progress. Working scientists know that a day in the library can save a year in the laboratory when measuring climate change.
Good science questions competing assertions about climate change. For example, can the statement under consideration, in principle, be proven false? Has it been rigorously tested? Did it appear in the peer-reviewed literature? Did it build on the existing research record where appropriate? If the answer to any of these questions is no, then less credence should be given to the assertion until it is tested and independently verified.
Uncertainties in Measuring Climate Change
The history of the centuries-long effort to document and understand climate change is often complex, marked by successes and failures, and has followed a very uneven pace. Testing scientific findings and openly discussing the test results have been the key to the remarkable progress that is now accelerating in all domains, in spite of inherent limitations to predictive capacity. Climate change science is now contributing to the foundation of a new interdisciplinary approach to understanding our environment. Consequently, much published research and many notable scientific advances have occurred in the last few decades, including advances in the understanding and treatment of uncertainty.
Uncertainties can be classified in several different ways according to their origin. Two primary types are ‘value uncertainties’ and ‘structural uncertainties’. Value uncertainties arise from the incomplete determination of particular values or results, for example, when data are inaccurate or not fully representative of the phenomenon of interest. Structural uncertainties arise from an incomplete understanding of the processes that control particular values or results, for example, when the conceptual framework or model used for analysis does not include all the relevant processes or relationships.
Uncertainties associated with ‘random errors’ have the characteristic of decreasing as additional measurements are accumulated, whereas those associated with ‘systematic errors’ do not. In dealing with climate records, scientists give considerable attention to the identification of systematic errors or unintended biases arising from data sampling issues and methods of analyzing and combining data.
Fortunately, science is inherently self-correcting; incorrect or incomplete scientific concepts ultimately do not survive repeated testing against observations of nature.
Page based on 2007 IPCC Fourth Report, updated 15 December 2010.