 Climate change temperature refers to how hot or cold the atmosphere,ocean or landmass is as measured by a thermometer as indicator by Celsius (C), Fahrenheit (F), or Kelvin (K)references.
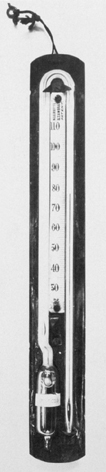
Air temperature can be measured with a thermometer, invented by Italian mathematician Galileo Galilei about 1592. The basic design – a fluid-filled hollow glass bulb attached to a stem with a thread-like bore – is still used today. A traditional thermometer consists of mercury, or spirit in a glass tube and operates on the principle that the liquid expands more that the glass does when heated.
Thermometers are placed in specially designed shelters such as the Stevenson screen, a white, louvered box positioned about a metre above the ground. In 1718 Gabriel Daniel Fahrenheit (Germany) devised the Fahrenheit scale for measuring temperature. The Celsius temperature scale was formulated by Swedish astronomer Anders Celsius in 1742.
Digital electronic devices can also be used were the unit can record the max and min temperature reached and some units can store a series of data (a data logger) and others transmit an electronic signal measuring temperature back to a second temperature display on a PC or a base. These new probes can also be used to measure soil temperature.
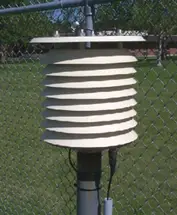 The Electronic Maximum-Minimum Temperature Sensor (MMTS) have to a large extent replaced the old thermometer shown above. An electronic temperature sensor that replaces glass thermometers are housed in a white case to reflect sunlight and has vents all around so that the air flows freely over the temperature sensor inside. The idea is to measure the temperature in the shade, away from any direct effect of the sun. There are literally tens of thousands of devices like this measuring the temperature of air around the globe. Besides feeding into the bigger picture of climate change, these devices are important to our everyday life.
Upper Air Climate Change Temperature
The Radiosonde is a balloon-borne instrument platform with a battery powered device (new versions are little larger than a softdrink can) which relays information to a sensitive ground receiver at a tracking station near the launch site.
The radiosonde contains instruments capable of making direct in-situ measurements of air temperature, humidity and pressure with height, typically to altitudes of approximately 30 km. These observed data are transmitted immediately to the ground station by a radio transmitter located within the instrument package.
The ascent of a radiosonde provides an indirect measure of the wind speed and direction at various levels throughout the troposphere. Ground based radio direction finding antenna equipment track the motion of the radiosonde during its ascent through the air. The recorded elevation and azimuth information are converted to wind speed and direction at various levels by triangulation techniques.
Climate Change Temperature from Aircraft
NASA has for years maintained an orbiting fleet, a sensor web, of satellites that monitor the Earth’s natural systems, including climate change temperature. As you can see in the movie below, the sensor web is in a constant state of motion, and each satellite is designed to look at a different aspect of the Earth.
NASA also maintains an airborne sciences division, which comprises a fleet of high altitude, high-tech scientific research aircraft. One of these is the DC-8. With aircraft such as this, scientists can get inside the clouds of a developing hurricane. Getting a good satellite overpass during the exact time and location of a developing hurricane is a matter of luck. But with an aircraft, you can pilot it or target it directly into the location where critical storm elements are coming together and you can stay there to study the atmospheric processes for hours.
Perhaps NASA’s most unusual aircraft is the ER-2, a research version of the U-2 spy plane. Its long, narrow wings distinguish this aircraft. It flies at an altitude of 70,000 feet – so high that the single pilot must wear a pressurized spacesuit. From these great heights, the aircraft flies over the dome-like top of hurricanes, and measures amongst other things climate change temperature.
Video from: NASA, Goddard Scientific Visualization Studio
The Sea and Climate Change Temperature
Since the 1980s satellites have been increasingly utilised to measure sea surface temperature (SST) and have provided an enormous leap in our ability to view the spatial and temporal variation in SST. The satellite measurement is made by sensing the ocean radiation in two or more wavelengths in the infrared part of the electromagnetic spectrum which can then be empirically related to SST.
Also and since 2002, new measurements have come from an international collaboration called Argo, a global array of 3,000 free-drifting floats that measure temperature and salinity of the ocean’s upper 2,000 meters.
At 10-day intervals, the floats pump fluid into an external bladder and rise from 2,000 meters to the surface over a six-hour period while taking measurements. Satellites determine the floats’ positions when they surface and receive their transmitted data. The bladder then deflates and the float sinks to drift until the cycle repeats.
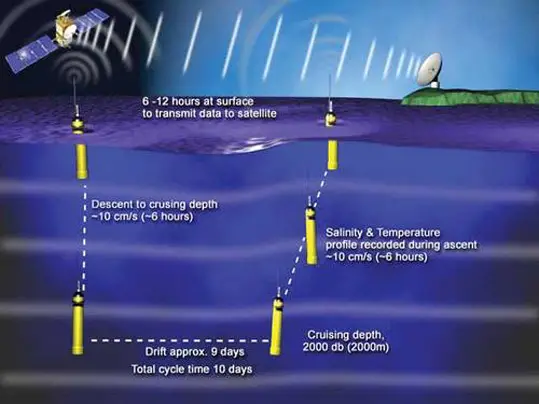
An Argo profiling float cycling through the water column. Graphic courtesy of National Oceanographic Centre Southampton 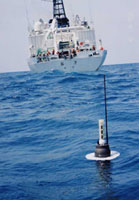 The Argo.avi (24.7 mb) is a float animation that explains the purpose and method of Argo. Argo is a major contributor to the WCRP’s Climate Variability and Predictability Experiment (CLIVAR) project and to the Global Ocean Data Assimilation Experiment (GODAE). The Argo array is part of the Global Climate Observing System/Global Ocean Observing System GCOS/ GOOS)and full details of this comprehensive program is available at the Argo home page.