Measuring biomass: Biomass refers to living and recently dead biological material and excludes organic material which has been transformed by geological processes into substances such as coal or petroleum. It is usually measured by dry weight, and is the total mass of living matter.
The effects of climate change on plants, animals and biomass generally are quite difficult to measure, but potentially dramatic (see also biodiversity ). Many plant and animal species inhabit precisely bounded ecological niches, and even small changes in climate may cause fundamental disruptions in habitat or food availability. In the past, animals found it easier to respond to climate pressures by moving from one place to another. However, land development and many other human uses of the environment has constrained and fragmented ranges and travel routes, making species migration in response to climate change much more difficult.
The purpose of the climate change detection and monitoring activity is to identify variability and trends in the climate system. In understanding these changes we are able to identify specific causative factors, whether natural or human-induced. 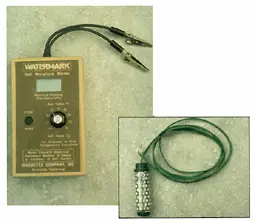 Soil Monitoring
Long-term monitoring of soil has become routine in the past twenty years as data loggers and electronic monitoring equipment become widespread. These types of automated electronic monitoring systems have distinct advantages as they can be automated to collect data unattended. They can also collect numerous measurements each day, and do not require laboratory conditions to provide results
Insects
Historical record of insects and disease infested areas can be collected with yearly aerial surveys. Hand held sweep nets are often used for insects such as lygus bugs, some aphids, and beneficial insects, as they are often very mobile, and hard to monitor any other way. Insects are also caught and monitored by using various insect traps including sticky traps, light traps, pitfall traps and pheromone traps. Radar has also been successfully used for over twenty years to study the flight behaviour of a variety of migrant insects. Observation satellites are now used to collect imagery on forests which can map the devastation caused by insect infestations (e.g. Mountain Pine Beetle ).
Satellite Monitoring
The MODIS Rapid Response System was developed to provide daily satellite images of the Earth’s landmasses in near real time. True-colour, photo-like imagery and false-colour imagery are available within a few hours of being collected, making the system a valuable resource for organisations like the U.S. Forest Service and the international fire monitoring community, who use the images to track fires. As the climate changes and some areas prone to experiencing less rainfall, fire activity will increase and measuring biomass in this way is extremely important to fire fighting authorities.
Here is a the NASA site, where you can view the locations of the fires detected by MODIS on board the Terra and Aqua satellites over a 10-day period.
The geographic ranges of plant species are affected by climatic change. Surface sampling and instrumentation can provide very detailed data records at a particular ground location, but time series satellite images provide information on changes to vegetation cover and density at a regional level.
Satellite images can pick up dust blown from the land surface, a process of degradation and often desertification. These fine-grained minerals are critical to vegetation growth, and also create potentially hazardous air quality to humans on a local and regional scale, and adversely affecting climate on a regional and world-wide scale.
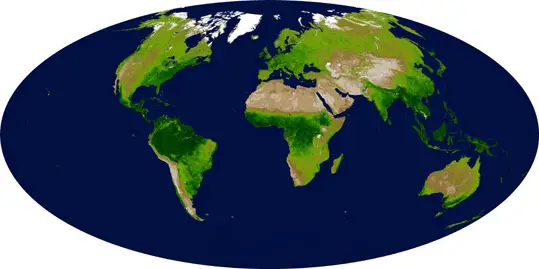
The above MODIS Enhanced Vegetation Index (EVI) map above shows the density of plant growth over the entire globe. Very low values of EVI (white and brown areas) correspond to barren areas of rock, sand, or snow. Moderate values (light greens) represent shrub and grassland, while high values indicate temperate and tropical rainforests (dark greens). The MODIS EVI gives scientists a new tool for monitoring major fluctuations in vegetation and understanding how they affect, and are affected by, regional climate trends. ![]() Animal Tracking
Animal Tracking
The use of Global Navigation Satellite Systems (GNSS) in animal tracking has become widespread since the commercial development of the first units in 1991. The recorded location data can be stored within the tracking unit or may be transmitted to a centrally located data store, or internet-connected computer, using an embedded cellular (GPRS), radio, or satellite modem. This allows the animal’s location to be plotted against a map or chart either in real-time or when analyzing the track later using a GIS package or custom software.
The NOAAs turtle study is a pioneer in showing the value of combining animal movements and oceanographic data from satellite remote sensing. Tracking animals is useful within a climate context as it provides information on movement and range than can be compared in later studies to better understand the changing environment.
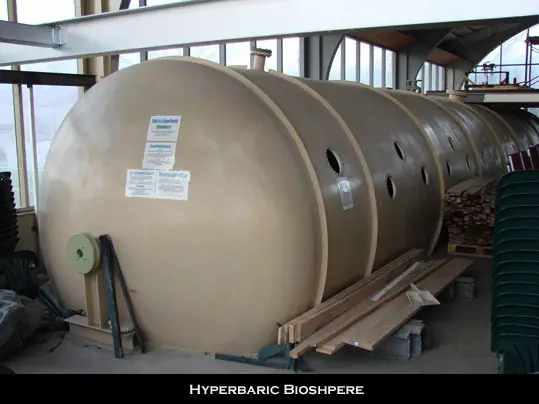
Experiments in Controlled Environments
In 1999, Dr. Carl Baugh patented a small “Hyperbaric Biosphere”. This unique chamber, designed to emulate the conditions thought to exist on the early earth, is located in Glen Rose, Texas. It provides double atmospheric pressure, enhanced oxygen, and protection from ultraviolet radiation, while magnetic coils attempt to make up for earth’s reduced magnetic field. Initial results from ongoing tests with fruit flies, poisonous snakes, and other organisms point to some dramatic differences in creatures living in this environment compared to a control group; for example, the lifespan of fruit flies has been tripled, and the toxicity level of copperhead snake venom has been lowered.
A much larger (62-foot) hyperbaric biosphere is currently under construction in the same location, and is one of many devices that could be used to study climate change.