The main ice covered landmass is Antarctica at the South Pole, with about 90 percent of the world’s ice (and 70 percent of its fresh water). Antarctica is covered with ice an average of 2,133 metres (7,000 feet) thick, and in many places thickness exceeds 4,000 metres (13,123 feet), reaching a maximum of 4,800 metres(15,748 feet). The British Antarctic Survey estimates the volume of the ice sheet to be 30 million cubic kilometres.
If all this were to melt, sea levels would rise by 57 m (187 feet) and the interior of the continent would also rise. This rebound would be caused by the huge weight redistribution of ice sheets as they change to water and enter the sea. The weight of the Antarctic ice is so great that in many areas it actually pushes the land below sea-level and if the ice cover was removed Antarctica would slowly rise up another 450 metres (1500 feet) above sea-level. The average temperature is -37°C, so the ice this should take an extended period of time to melt. In fact in most parts of the continent it never gets above freezing.
The whole ice sheet is divided into three main components:
1. The East Antarctic ice sheet, mainly occupying ground above sea level and which is therefore relatively stable;
2. The West Antarctic ice sheet, resting on a bed that is mainly below sea-level and which is therefore vulnerable to catastrophic collapse; and
3. The Antarctic Peninsula ice sheet, a relatively small volume of ice covering the land of the same name that stretches towards South America.
The International Panel on Climate Change (IPCC) in 2001 emphasised that human induced climate change has the potential to trigger large scale changes in Earth systems, that could have severe consequences at a global scale. If the rising temperature affects glaciers and icebergs, could the polar ice caps be in danger of melting and causing the oceans to rise? The U.S. National Research Council issued a report summarised by a group of scientists who state, “…it is conceivable that human forcing of climate change is increasing the probability of large, abrupt events. Were such an event to recur, the economic and ecological impacts could be large and potentially serious”.
In studying icebergs, scientists recognise that the final stages of iceberg break-up imitate the rapid disintegration of ice shelves caused by climate warming. Floating shelves of ice on the Antarctic Peninsula are experiencing temperatures and melt rates that they can no longer withstand. Ice shelves are important because they help control glacier flow; removal of ice shelves causes rapid glacier acceleration and calving. Already we have seen the collapse and break-up of the Wordie and Larsen Ice Shelves.
The collapse of the Larsen Ice Shelf was the largest single disintegration event in 30 years of ice shelf monitoring (yellow section on map below). Preliminary studies of sediment cores suggest that it may have been this ice shelf’s first collapse in 12,000 years.
A huge section from the Ross Ice Shelf (red coloured portion on map below) called theB15 icberg also broke away. It was the largest single free floating iceberg ever recorded.
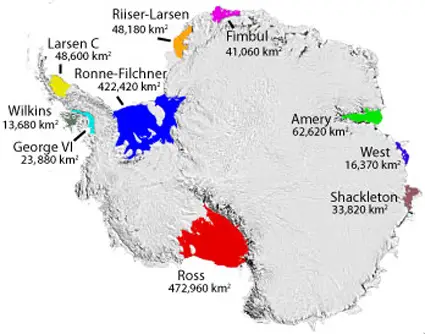
Image: Antarctica’s major ice shelf areas in Antarctica. Image courtesy of Ted Scambos, National Snow and Ice Data Center, University of Colorado, Boulder.
At the other end of the world, at the North Pole , the ice is not nearly as thick as at the South Pole. The ice floats on the Arctic Ocean. There is a significant amount of ice covering Greenland, which would add another 7 metres (20 feet) to the oceans if it melted. Because Greenland is closer to the equator than Antarctica, the temperatures there are higher, and the ice is melting relatively quickly. A marked warming trend is evident in the Antarctic Peninsula, with spectacular loss of ice shelves, and movement of glaciers which must cause a rethink of the stability of the larger West Anatarctic Ice Sheet.
The IPCC issued a report which contained various projections of the sea level change by the year 2100. They estimate that the sea will rise 50 centimeters (20 inches) with the lowest estimates at 15 centimeters (6 inches) and the highest at 95 centimeters (37 inches). Sea level rise takes place through two processes; thermal expansion of the ocean and from melting glaciers and ice sheets.
Twenty inches is no small amount — apart from swamping many low lying areas and coastal cities, many more coastal strips will feel the impact, especially during storms.
Antarctica: A Flying Tour of the Frozen Continent – This 5 minute, narrated tour of Antarctica is through the eyes of RADARSAT. Completed and accepted for the SIGGRAPH 2001 Computer Animation Festival.
Video credits: NASA/Goddard Space Flight Center Scientific Visualization Studio. Additional credit goes to Canadian Space Agency, RADARSAT International Inc.