From: IPCC, AR4, WGI, Chapter 10 Global Climate Projections, Future Abrupt Climate Change, ‘Climate Surprises’, and Irreversible Changes.
Theory, models and palaeoclimatic reconstructions have established the fact that changes in the climate system can be abrupt and widespread. A working definition of ‘abrupt climate change’ is given in Alley et al. (2002): ‘technically, an abrupt climate change occurs when the climate system is forced to cross some threshold, triggering a transition to a new state at a rate determined by the climate system itself and faster than the cause’.
More generally, a gradual change in some determining quantity of the climate system (e.g., radiation balance, land surface properties, sea ice, etc.) can cause a variety of structurally different responses (se below Box 10.1, Figure 1). The response of a purely linear system scales with the forcing, and at stabilisation of the forcing, a new equilibrium is achieved which is structurally similar, but not necessarily close to the original state. However, if the system contains more than one equilibrium state, transitions to structurally different states are possible. Upon the crossing of a tipping point (bifurcation point), the evolution of the system is no longer controlled by the time scale of the forcing, but rather determined by its internal dynamics, which can either be much faster than the forcing, or significantly slower. Only the former case would be termed abrupt climate change, but the latter case is of equal importance.
For the long-term evolution of a climate variable one must distinguish between reversible and irreversible changes. The notion of ‘climate surprises’ usually refers to abrupt climate change transitions and temporary or permanent transitions to a different state in parts of the climate system such as, for example, the 8.2 kyr event (see Section 6.5.2.1).
Atlantic Meridional Overturning Circulation [MOC] and other ocean circulation changes:
The best-documented type of abrupt climate change in the palaeoclimatic archives is that associated with changes in the ocean circulation. Since the TAR, many new results from climate models of different complexity have provided a more detailed view on the anticipated changes in the Atlantic MOC in response to global warming.
Most models agree that the MOC weakens over the next 100 years and that this reduction ranges from indistinguishable from natural variability to over 50% by 2100. None of the AOGCM simulations shows an abrupt change when forced with the SRES emissions scenarios until 2100, but some long-term model simulations suggest that a complete cessation can result for large forcings (Stouffer and Manabe, 2003). Models of intermediate complexity indicate that thresholds in the MOC may be present but that they depend on the amount and rate of warming for a given model (Stocker and Schmittner, 1997). The few long-term simulations from AOGCMs indicate that even complete shutdowns of the MOC may be reversible (Stouffer and Manabe, 2003; Yoshida et al., 2005; Stouffer et al., 2006b). However, until millennial simulations with AOGCMs are available, the important question of potential irreversibility of an MOC shutdown remains unanswered.
Both simplified models and AOGCMs agree, however, that a potentially complete shut-down of the MOC, induced by global warming, would take many decades to more than a century. There is no direct model evidence that the MOC could collapse within a few decades in response to global warming. However, a few studies do show the potential for rapid changes in the MOC (Manabe and Stouffer, 1999), and the processes concerned are poorly understood. This is not inconsistent with the palaeoclimate records. The cooling events during the last ice ages registered in the Greenland ice cores developed over a couple of centuries to millennia. In contrast, there were also a number of very rapid warmings, the so-called Dansgaard-Oeschger events (NorthGRIP Members, 2004), or rapid cooling (LeGrande et al., 2006), which evolved over decades or less, most probably associated with rapid latitudinal shifts in ocean convection sites and changes in strength of the MOC.
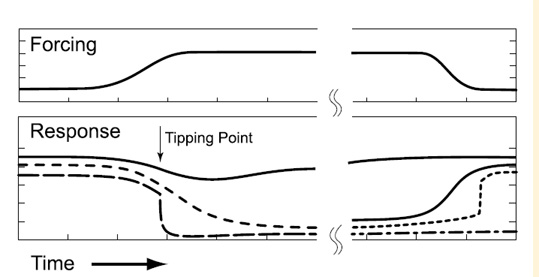
Box 10.1, Figure 1. Schematic illustration of various responses of a climate variable to forcing. The forcing (top panels) reaches a new stable level (left part of figure), and later approaches the original level on very long time scales (right part of the figure). The response of the climate variable (bottom panels) can be smooth (solid line) or cross a tipping point inducing a transition to a structurally different state (dashed lines). That transition can be rapid (abrupt climate change, long-dashed), or gradual (short-dashed), but is usually dictated by the internal dynamics of the climate system rather than the forcing. The long-term behaviour (right part) also exhibits different possibilities. Changes can be irreversible (dash-dotted) with the system settling at a different stable state or reversible (solid, dotted) when the forcing is set back to its original value. In the latter case, the transition again can be gradual or abrupt. An example for illustration, but not the only one, is the response of the Atlantic meridional overturning circulation to a gradual change in radiative forcing.
Recent simulations with models with ocean components that resolve topography in sufficient detail obtain a consistent pattern of a strong to complete reduction of convection in the Labrador Sea (Wood et al., 1999; Schweckendiek and Willebrand, 2005). Such changes in the convection, with implications for the atmospheric circulation, can develop within a few years (Schaeffer et al., 2002). The long-term and regional-to-hemispheric scale effects of such changes in water mass properties have not yet been investigated.
With a reduction in the MOC, the meridional heat flux also decreases in the subtropical and mid-latitudes with large-scale effects on the atmospheric circulation. In consequence, the warming of the North Atlantic surface proceeds more slowly. Even for strong reductions in MOC towards the end of the 21st century, no cooling is observed in the regions around the North Atlantic because it is overcompensated by the radiative forcing that caused the ocean response in the first place.
At high latitudes, an increase in the oceanic meridional heat flux is simulated by these models. This increase is due to both an increase in the overturning circulation in the Arctic and the advection of warmer waters from lower latitudes and thus contributes significantly to continuing sea ice reduction in the Atlantic sector of the Arctic (A. Hu et al., 2004). Few simulations have also addressed the changes in overturning in the South Atlantic and Southern Ocean. In addition to water mass modifications, this also has an effect on the transport by the Antarctic Circumpolar Current, but results are not yet conclusive.
Arctic sea ice: Arctic sea ice is responding sensitively to global warming. While changes in winter sea ice cover are moderate, late summer sea ice is projected to disappear almost completely towards the end of the 21st century. A number of positive feedbacks in the climate system accelerate the melt back of sea ice. The ice-albedo feedback allows open water to receive more heat from the Sun during summer, and the increase in ocean heat transport to the Arctic through the advection of warmer waters and stronger circulation further reduces ice cover. Minimum arctic sea ice cover is observed in September. Abrupt climate change model simulations indicate that the September sea ice cover decreases substantially in response to global warming, generally evolving on the time scale of the warming. With sustained warming, the late summer disappearance of a major fraction of arctic sea ice is permanent.
Glaciers and ice caps: Glaciers and ice caps are sensitive to changes in temperature and precipitation. Observations point to a reduction in volume over the last 20 years with a rate during 1993 to 2003 corresponding to 0.77 ± 0.22 mm yr–1 sea level equivalent, with a larger mean central estimate than that for 1961 to 1998 (corresponding to 0.50 ± 0.18 mm yr–1 sea level equivalent). Rapid changes are therefore already underway and enhanced by positive feedbacks associated with the surface energy balance of shrinking glaciers and newly exposed land surface in periglacial areas. Acceleration of glacier loss over the next few decades is likely. Based on simulations of 11 glaciers in various regions, a volume loss of 60% of these glaciers is projected by the year 2050 (Schneeberger et al., 2003). Glaciated areas in the Americas are also affected. A comparative study including seven GCM simulations at 2 × atmospheric CO2 conditions inferred that many glaciers may disappear completely due to an increase in the equilibrium line altitude (Bradley et al., 2004). The disappearance of these ice bodies is much faster than a potential re-glaciation several centuries hence, and may in some areas be irreversible.
Greenland and West Antarctic Ice Sheets: Satellite and in situ measurement networks have demonstrated increasing melting and accelerated ice flow around the periphery of the Greenland Ice Sheet (GIS) over the past 25 years. The few simulations of long-term ice sheet simulations suggest that the GIS will significantly decrease in volume and area over the coming centuries if a warmer climate is maintained (Gregory et al., 2004a; Huybrechts et al., 2004; Ridley et al., 2005). A threshold of annual mean warming of 1.9°C to 4.6°C in Greenland has been estimated for elimination of the GIS (Gregory and Huybrechts, 2006), a process which would take many centuries to complete.
Even if temperatures were to decrease later, the reduction of the GIS to a much smaller extent might be irreversible, because the climate of an ice-free Greenland could be too warm for accumulation; however, this result is model dependent. The positive feedbacks involved here are that once the ice sheet gets thinner, temperatures in the accumulation region are higher, increasing the melting and causing more precipitation to fall as rain rather than snow; that the lower albedo of the exposed ice-free land causes a local climatic warming; and that surface melt water might accelerate ice flow.
A collapse of the West Antarctic Ice Sheet (WAIS) has been discussed as a potential response to global warming for many years (Bindschadler, 1998; Oppenheimer, 1998; Vaughan, 2007). A complete collapse would cause a global sea level rise of about 5 m. The observed acceleration of ice streams in the Amundsen Sea sector of the WAIS, the rapidity of propagation of this signal upstream and the acceleration of glaciers that fed the Larsen B Ice Shelf after its collapse have renewed these concerns.
It is possible that the presence of ice shelves tends to stabilise the ice sheet, at least regionally. Therefore, a weakening or collapse of ice shelves, caused by melting on the surface or by melting at the bottom by a warmer ocean, might contribute to a potential destabilisation of the WAIS, which could proceed through the positive feedback of grounding-line retreat. Present understanding is insufficient for prediction of the possible speed or extent of such a collapse.
Vegetation cover: Irreversible and relatively rapid changes in vegetation cover and composition have occurred frequently in the past. The most prominent example is the desertification of the Sahara region about 4 to 6 ka (Claussen et al., 1999). The reason for this behaviour is believed to lie in the limits of plant communities with respect to temperature and precipitation. Once critical levels are crossed, certain species can no longer compete within their ecosystem. Areas close to vegetation boundaries will experience particularly large and rapid changes due to the slow migration of these boundaries induced by global warming.
A climate model simulation into the future shows that drying and warming in South America leads to a continuous reduction in the forest of Amazonia (Cox et al., 2000, 2004). While evolving continuously over the 21st century, such a change and ultimate disappearance could be irreversible, although this result could be model dependent since an analysis of 11 AOGCMs shows a wide range of future possible rainfall changes over the Amazon (Li et al., 2006).
One of the possible ‘climate surprises’ and linked to the idea of abrupt climate change, concerns the role of the soil in the global carbon cycle. As the concentration of CO2 is increasing, the soil is acting, in the global mean, as a carbon sink by assimilating carbon due to accelerated growth of the terrestrial biosphere. However, by about 2050, a model simulation suggests that the soil changes to a source of carbon by releasing previously accumulated carbon due to increased respiration (Cox et al., 2000) induced by increasing temperature and precipitation. This represents a positive feedback to the increase in atmospheric CO2.
While different models agree regarding the sign of the feedback, large uncertainties exist regarding the strength (Cox et al., 2000; Dufresne et al., 2002; Friedlingstein et al., 2006). However, the respiration increase is caused by a warmer and wetter climate. The switch from moderate sink to strong source of atmospheric carbon is rather rapid and occurs within two decades (Cox et al., 2004), but the timing of the onset is uncertain (Huntingford et al., 2004). A model intercomparison reveals that once set in motion, the increase in respiration continues even after the CO2 levels are held constant (Cramer et al., 2001).
Although considerable uncertainties still exist, it is clear that feedback mechanisms between the terrestrial biosphere and the physical climate system exist which can qualitatively and quantitatively alter the response to an increase in radiative forcing.
Atmospheric and ocean-atmosphere regimes: Changes in weather patterns and regimes can be abrupt processes that might occur spontaneously due to dynamical interactions in the atmosphere-ice-ocean system, or manifest as the crossing of a threshold in the system due to slow external forcing.
Such shifts have been reported in [Sea Surface Temperatures] SST in the tropical Pacific, leading to a more positive ENSO phase (Trenberth, 1990), in the stratospheric polar vortex (Christiansen, 2003), in a shut-down of deep convection in the Greenland Sea (Bönisch et al., 1997; Ronski and Budeus, 2005) and in an abrupt freshening of the Labrador Sea (Dickson et al., 2002). In the latter, the freshening evolved throughout the entire depth but the shift in salinity was particularly rapid: the 34.87 psu isohaline plunged from seasonally surface to 1,600 metres within 2 years with no return since 1973.
In a long, unforced model simulation, a period of a few decades with anomalously cold temperatures (up to 10 standard deviations below average) in the region south of Greenland was found (Hall and Stouffer, 2001). It was caused by persistent winds that changed the stratification of the ocean and inhibited convection, thereby reducing heat transfer from the ocean to the atmosphere.
Similar results were found in a different model in which the major convection site in the North Atlantic spontaneously switched to a more southerly location for several decades to centuries (Goosse et al., 2002). Other simulations show that the slowly increasing radiative forcing is able to cause transitions in the convective activity in the Greenland-Iceland-Norwegian Sea that have an influence on the atmospheric circulation over Greenland and Western Europe (Schaeffer et al., 2002). The changes unfold within a few years and indicate that the system has crossed a threshold.
A multi-model analysis of regimes of polar variability (NAO, Arctic and Antarctic Oscillations) reveals that the simulated trends in the 21st century influence the Arctic and Antarctic Oscillations and point towards more zonal circulation (Rauthe et al., 2004). Temperature changes associated with changes in atmospheric circulation regimes such as the NAO can exceed in certain regions (e.g., Northern Europe) the long-term global warming that causes such inter-decadal regime shifts (Dorn et al., 2003).
Material sourced from: IPCC, AR4, WGI, Chapter 10 Global Climate Projections, Future Abrupt Climate Change, ‘Climate Surprises’, and Irreversible Changes